Contents:
Practical examples
Start an analysis
Filters and distributions
Analysis of details in the graph
View of the last active rate
The forecast
Analysis of details in the tiles
Analysis of details in the table
Practical examples
Hotel data analysis can help you answer questions about the development of business figures. You can quickly and easily get an overview of a specific period in the main chart or explore in depth with detailed KPI analysis, as the following examples show:
- How have my total revenue, RevPar and ADR developed compared to the past two years? (For example, after the introduction of revenue management from a certain point in time)
→ see Analysis of details in the tiles
-
What occupancy and revenue does RateBoard's intelligent forecast predict? Forecast models support dynamic pricing and optimal resource planning. This allows you to optimise revenue, staff planning and marketing campaigns based on data.
→ see Forecast - Which room categories, channels and nationalities contributed most to revenue?
→ see Filter & distributions
- How have the rates for certain room categories changed over time and what impact has this had on the rooms sold?
→ see Analysis of details in the tiles, especially the rate updates and development diagrams
- What effects do higher or lower rates have on occupancy over time?
→ see Analysis of details in the graph, additionally display the active rate
Start an analysis
Open the Hotel Data page in RateBoard. To do this, navigate to Analysis in the main menu and then to Hotel Data.

- Start by selecting a KPI in the filters. You can choose from occupancy, revenue, ADR and RevPar.
Tip: Are you still unsure about the definition of individual KPIs and how they are calculated? You can find all the explanations here: Abbreviations and terms – cheat sheet
-
Select a time period – for example, analyse revenue over a period of 3 months with a view to the upcoming weeks. The period is defined using the date range slider below the diagram. Select the start and end dates of the required period by moving the two bars.
Important: The data displayed comes from your PMS and, depending on the PMS, includes revenue generated purely from accommodation or also includes breakfast or half board. (However, the initially configured standard rate does not include local taxes, income from the spa area, etc.)
Note: Switch between net and gross revenues using the slider at the top right of the page.

- Optionally, set the values in comparison to a reference. Up to two reference dates can be set in the filters, whereby a choice can be made between the exact same date or the corresponding same day of the week 1 or 2 years ago.
- Refine the analysis by using filters or select a detailed view of the distribution of a specific KPI and its characteristics. For more information about the available configurations, see the section Filters and distributions.
- Analyse your data on a daily basis using the graph, table or detail tiles.
- Save the filters you use most often under Presets so that you can access the filter combination more quickly next time.

Filters and distributions
You can get detailed insights into the breakdown and distribution of analysis results by using filters and distribution. To do this, select your desired attributes in the top bar.

Filters limit the analysis results to only specific information. For example, if you select the room category ‘Standard’, only data from this category will be displayed.
The following options are available in the filter selection:
- Pickup: you can choose whether you want to display the pickup for the last 1, 3, 7, 14, 30, 60 or 90 days.
Note: Here we show the net pickup for the selected pickup date range. For example, for a pickup filter of 90 days, this means that the number of rooms booked minus the number of cancellations booked in the last 90 days is displayed. - Room category: The room categories are those you have specified in your inventory settings.
- Room type: The room types are the same as those you set up and use in your PMS.
- Segments: The segments available for this analysis are the same ones you set up and use in your PMS.
- Segment categories: The segment categories available for this analysis are those you assign to the segments used in the PMS in the rate board settings. (Further information can be found here)
- Channels: The channels available for this analysis correspond to the channels you set up and use in your PMS.
- Countries: The countries available for this analysis correspond to the countries you set up and use in your PMS.
When using distributions, you get a detailed view of the breakdown of KPIs. This is particularly helpful in understanding which room categories, channels or nationalities contributed most to revenue or occupancy.
Possible distribution views are:
- Segments
- Segment categories
- Channels
- Room type
- Room category
- Countries
- PickUp
Example: For the selected pickup distribution (e.g. 90 days), we show the development of the booking situation over the last 90 days. OTB shows the total number of bookings and cancellations that were made more than 90 days ago. The ‘Confirmed’ and ‘Cancelled’ bars show all bookings and cancellations that took place during the 90 days.
Analysis of details in the graph
The graph always reflects the result of the set parameters. The date range slider can be used to adjust the displayed period flexibly. The bars show the result on a daily basis in dark blue (current year) and light grey (selected reference periods). Events are also displayed, if they have been maintained.
Note: By clicking on elements in the legend, you can quickly and easily show and hide layers in the graph.
If you move the mouse over a bar, all relevant information for the respective day is listed. This gives you insight into the exact percentages of KPIs or selected distributions, for example.

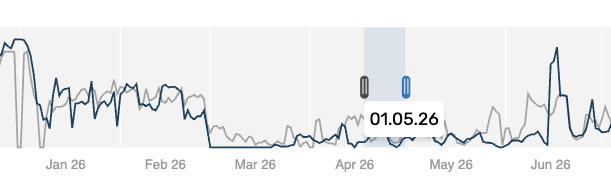
View of the last active rate
At the top right of the graph, there is a selection option called ‘Show active rate’. Here, you can select a room category and the last valid room rate for it will be displayed graphically as a line.
Information about the last active rate for a specific day is displayed when you move the mouse over one of the bars. This analysis is particularly useful for determining the effects of higher or lower rates on occupancy.

The forecast
The blue line in the graph shows the daily updated forecast for the selected KPI (revenue or occupancy).
Note: The forecast view is available 1 month after the onboarding process for new hotels has been completed.
This AI forecast can provide you with indications of the expected development. The forecast is displayed for the next 12 months. The shading behind the line represents the probable range of fluctuation in the forecast.
The intelligent model evaluates the quality of your hotel's basic data and forecast based on specified criteria. If our requirements for an effective forecast are not met, no forecast will be displayed.
As the market leader with 10 years of experience and part of the Zucchetti Group, we use a large data pool that gives you a decisive advantage in your forecasts
Important: A forecast for the real world can never be 100% accurate, as the future is uncertain by nature. Hoteliers should therefore always combine it with their valuable expertise, experience and realistic perspective.

Analysis of details in the tiles
By clicking on a specific bar in the diagram, it is possible to evaluate the KPIs for a specific date in deeper detail. Tiles will open at the top of the page, displaying the following data:
- Vacant rooms: current free capacity on the selected day.
- Forecast: outlook for the expected number of rooms sold and occupancy on the selected day. If the KPI revenue has been selected, the revenue forecast is displayed.*
- Revenue, occupancy, RevPar & ADR: Display of the current ‘on-the-books’ status of the KPI and, if applicable, display of the difference to the selected reference dates if references have been selected in the filters at the top.
- Rate updates: this diagram shows the valid rates per room category over time.
- Development: This diagram shows the development of bookings over time. The development of rooms sold in the current year is shown in dark blue. If the arrival date is still in the future, the line is continued as a dotted line to show the forecast development.
*The forecast for the next 12 months is only displayed if the data basis is sufficient according to specified criteria.

Analysis of details in the table
All results shown graphically above are also presented in tabular form and listed on a daily basis. By selecting KPIs, filters, distribution and references, the table can be flexibly structured according to your needs.
